Unleashing the Power of Python: A Game Changer for Excel Users and Aspiring Data Scientists a versatile and powerful programming language, has rapidly become a favorite tool among data scientists and programmers worldwide. Its simplicity, readability, and vast array of libraries make it an ideal choice for both beginners and experienced professionals. For Excel users and aspiring data scientists, Python offers a game-changing opportunity to enhance data analysis capabilities, automate repetitive tasks, and delve deeper into the world of data science.
This article explores how Python can transform the way you handle data, providing detailed insights into its applications, advantages, and how to get started. By the end of this guide, you will understand why Python is a must-learn for Excel users and those looking to advance their careers in data science.
The Evolution of Data Handling
The Role of Excel
Excel has long been the go-to tool for data analysis, accounting, and various business-related tasks. Its user-friendly interface and powerful functions allow users to manage data, perform calculations, and create visualizations with relative ease. Excel’s widespread adoption is due to its versatility and accessibility, making it an indispensable tool in many industries.
However, as data volumes grow and the complexity of data analysis increases, Excel’s limitations become apparent. Handling large datasets, performing advanced analytics, and automating tasks can be cumbersome and time-consuming. This is where Python comes into play, offering a robust solution to these challenges.
Unleashing the Power of Python
Python has emerged as a leading programming language in the world of data science and analytics. Its ease of use, combined with a vast ecosystem of libraries and frameworks, allows users to perform complex data manipulations, statistical analyses, and machine learning tasks with minimal effort. Python’s popularity is not just limited to data science; it is also widely used in web development, automation, and software development, making it a versatile skill to acquire.
Why Python is a Game Changer
Enhanced Data Handling Capabilities
One of Python’s most significant advantages over Excel is its ability to handle large datasets efficiently. Python’s libraries, such as Pandas and NumPy, provide powerful tools for data manipulation, cleaning, and transformation. These libraries enable users to perform operations on entire datasets with a few lines of code, which would otherwise require complex formulas and manual effort in Excel.
Pandas: The Data Manipulation Powerhouse
Pandas is a Python library specifically designed for data manipulation and analysis. It provides data structures like DataFrames and Series, which are optimized for handling structured data. With Pandas, you can easily read data from various file formats (CSV, Excel, SQL databases), perform data cleaning and transformation, and analyze data using built-in functions.
For example, consider the following Excel task: calculating the average sales per month from a large dataset. In Excel, this would require creating pivot tables, applying formulas, and possibly writing VBA scripts for automation. Unleashing the Power of Python: A Game Changer for Excel Users and Aspiring Data Scientists In Python, the same task can be accomplished with a few lines of Pandas code:
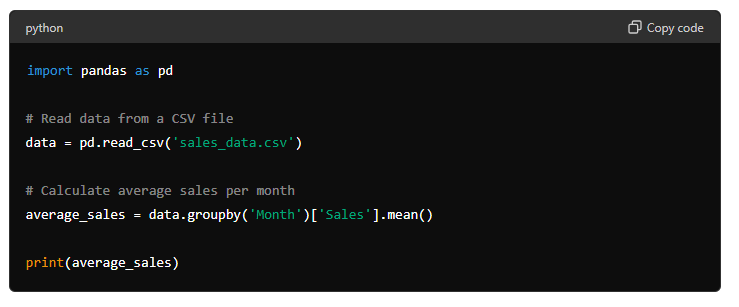
import pandas as pd

# Read data from a CSV file
data = pd.read_csv('sales_data.csv')

# Calculate average sales per month
average_sales = data.groupby('Month')['Sales'].mean()

print(average_sales)
Automation and Efficiency
Python excels in automating repetitive tasks, reducing the time and effort required for manual data processing. Tasks like data cleaning, report generation, and updating dashboards can be automated using Python scripts. This not only saves time but also ensures consistency and accuracy in data handling.Unleashing the Power of Python: A Game Changer for Excel Users and Aspiring Data Scientists.
Example: Automating Data Cleaning
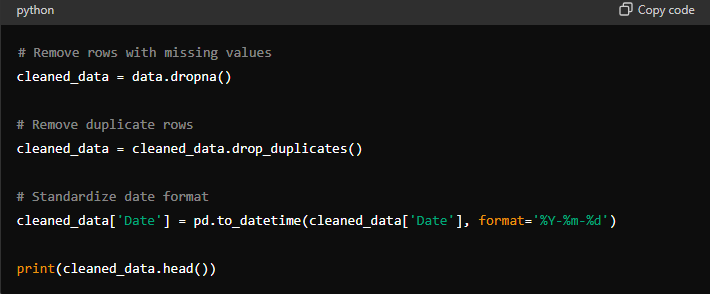
Data cleaning is a critical step in data analysis, often consuming a significant portion of the time spent on a project. Python’s Pandas library makes it easy to automate this process. For instance, handling missing values, removing duplicates, and standardizing data formats can be done efficiently with Python:
Advanced Analytics and Machine Learning
Python’s extensive library ecosystem includes powerful tools for statistical analysis, machine learning, and data visualization. Libraries such as Scikit-Learn, TensorFlow, and Matplotlib allow users to build predictive models, perform statistical tests, and create interactive visualizations.Unleashing the Power of Python: A Game Changer for Excel Users and Aspiring Data Scientists Unleashing the Power of Python: A Game Changer for Excel Users and Aspiring Data Scientists These capabilities go far beyond what Excel can offer, enabling users to unlock deeper insights from their data.
Scikit-Learn: Simplifying Machine Learning
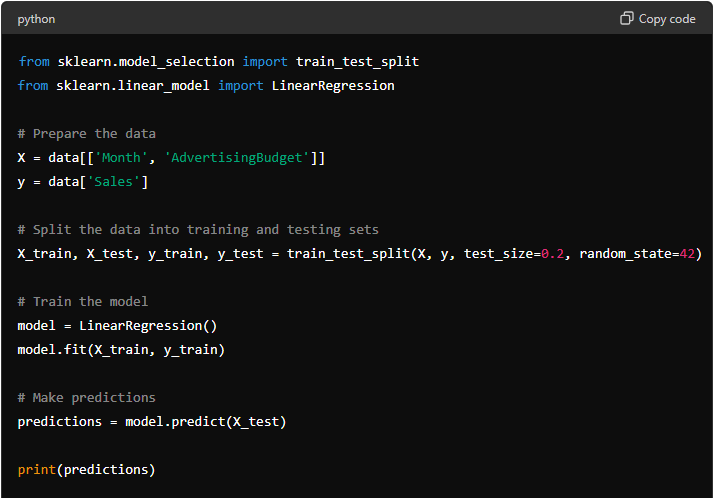
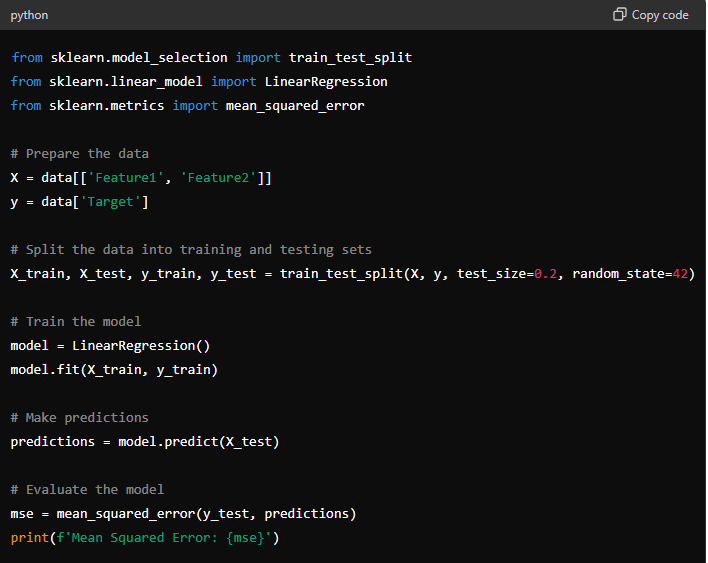
Scikit-Learn is a Python library that provides simple and efficient tools for data mining and data analysis. It supports various machine learning algorithms for classification, regression, clustering, and more. For example, building a predictive model to forecast sales based on historical data can be done effortlessly with Scikit-Learn:
Getting Started with Python for Excel Users
Installing Python and Essential Libraries
To start using Python, you’ll need to install Python itself and some essential libraries. The Anaconda distribution is a popular choice among data scientists as it comes bundled with many useful libraries and tools. Here’s how to get started:
- Download and Install Anaconda: Visit the Anaconda website and download the installer for your operating system. Follow the installation instructions to set up Anaconda on your computer.
- Set Up a Python Environment: Open the Anaconda Navigator and create a new Python environment. This will allow you to manage dependencies and avoid conflicts with other projects.Unleashing the Power of Python: A Game Changer for Excel Users and Aspiring Data Scientists .
- Install Essential Libraries: Use the following command to install libraries like Pandas, NumPy, and Scikit-Learn:

Learning the Basics of Python
If you’re new to Python, it’s essential to learn the basics before diving into more advanced topics. Here are some fundamental concepts to get you started:
- Variables and Data Types: Understand how to declare variables and the different data types in Python (e.g., integers, floats, strings, lists, dictionaries).
- Control Structures: Learn how to use loops (for, while) and conditional statements (if, elif, else) to control the flow of your programs.
- Functions: Learn how to define and call functions to organize your code and make it reusable.
- Libraries and Modules: Understand how to import and use libraries and modules to extend Python’s functionality.
There are numerous online resources, tutorials, and courses available to help you learn Python. Websites like Codecademy, Coursera, and Udemy offer comprehensive courses for beginners. Unleashing the Power of Python: A Game Changer for Excel Users and Aspiring Data Scientists.
Integrating Python with Excel
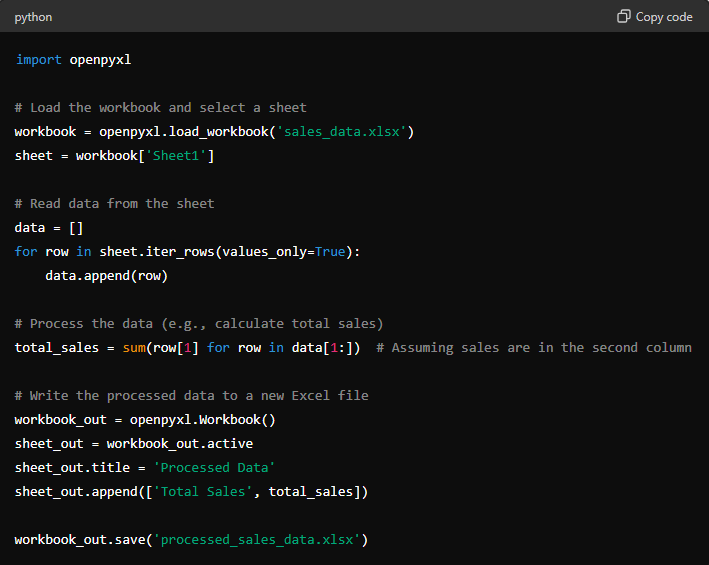
For Excel users, integrating Python with Excel can be a game changer. You can use libraries like openpyxl and pandas to read from and write to Excel files, automate data processing tasks, and create complex reports.
Reading and Writing Excel Files with openpyxl
openpyxl is a Python library that allows you to interact with Excel files. Here’s an example of how to read data from an Excel file and write the processed data to a new Excel file:
Visualization with Python
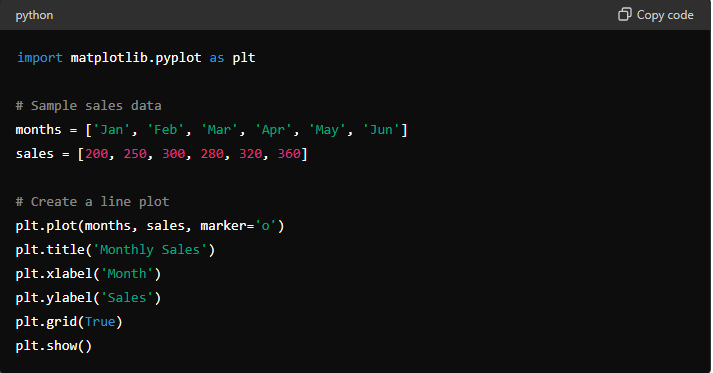
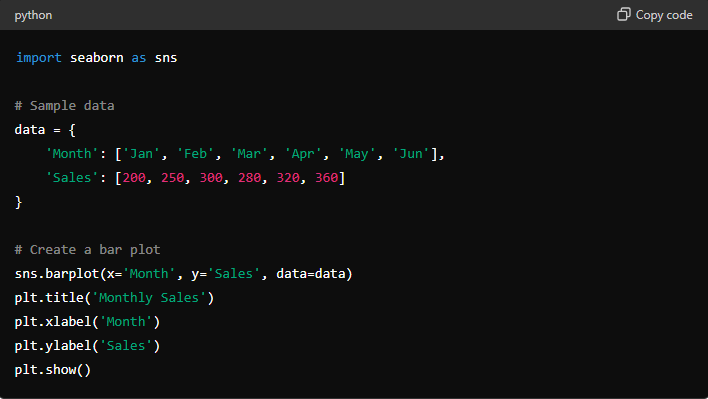
Visualizing data is a crucial aspect of data analysis. Python’s Matplotlib and Seaborn libraries offer powerful tools for creating a wide range of visualizations, from simple line plots to complex heatmaps.Unleashing the Power of Python: A Game Changer for Excel Users and Aspiring Data Scientists.
Creating Visualizations with Matplotlib
Matplotlib is a versatile plotting library that can create static, interactive, and animated visualizations. Here’s an example of how to create a line plot to visualize sales data:
Advanced Visualizations with Seaborn
Seaborn is built on top of Matplotlib and provides a high-level interface for creating attractive and informative statistical graphics. Here’s an example of how to create a bar plot using Seaborn:
Python for Advanced Data Science
Data Analysis and Manipulation
Python’s Pandas library is indispensable for data analysis and manipulation. It allows you to perform complex data transformations and aggregations with ease. Let’s look at a few advanced data manipulation techniques using Pandas:Unleashing the Power of Python: A Game Changer for Excel Users and Aspiring Data Scientists
Grouping and Aggregating Data
Grouping and aggregating data is a common task in data analysis. With Pandas, you can group data by one or more columns and apply various aggregation functions:

Merging and Joining DataFrames
Merging and joining DataFrames is essential when working with multiple datasets. Pandas provides powerful functions for combining data:
# Merge two DataFrames on a common column
merged_data = pd.merge(df1, df2, on='CommonColumn', how='inner')

print(merged_data.head())
Machine Learning with Python
Python’s machine learning libraries, such as Scikit-Learn, TensorFlow, and Keras, enable you to build predictive models and perform advanced analytics. Unleashing the Power of Python: A Game Changer for Excel Users and Aspiring Data Scientists Here’s an example of building a simple machine learning model using Scikit-Learn:
Building a Machine Learning Model
Python is undeniably a game changer for Excel users and aspiring data scientists. Its powerful libraries, ease of use, and ability to automate tasks make it an essential tool for anyone involved in data analysis. By learning Python, you can enhance your data handling capabilities, perform advanced analytics, and unlock new opportunities in the field of data science.
Whether you’re an Excel power user looking to streamline your workflow Unleashing the Power of Python: A Game Changer for Excel Users and Aspiring Data Scientists or an aspiring data scientist eager to delve into machine learning and advanced analytics, Python offers the tools and resources you need to succeed. Start your Python journey today and unleash the full potential of your data analysis capabilities.
- Tiffany Tyler: An In-Depth Look at Her Life and Career
- How Startups Put Their Data to Work with AWS?
- Familiar with looker write a review and avail 25 amazon gift card
- Correlation one apply for data skills for all a free career advancement program
- What Colleges Give Full-Ride Scholarships for Cheerleading?

